
Training Hub provides a variety of training data reports for different uses. The reports are hosted on the Tableau server and are refreshed hourly. The last refreshed timestamp appears at the top of the report under the title. All reports have the ability to download in various formats.
Note: All Training Hub report data only goes back to June 5, 2018. Older training data is available in the Reporting Center in MyU.
In this article:
- Understand who has access to Training Hub reports
- Report overviews
- Accessing reports
- Using filters to view a subset of data
- Downloading report data
Understand and request access to Training Hub reports
There are three roles that have access to reports.
- Training Report Viewer: This role has access to four Training Hub reports, and can be requested using the Request Access to Training Hub form.
- Training Administrator: This role is only granted to individuals needing to create and modify courses. It can be requested using the Request Access to Training Hub form
- Supervisor: All supervisors can access this report from Training Hub or from the Manager Info tab in MyU. Access is not granted to non-supervisors.
More information on administrative roles can be found in Training Hub: Compare Administrative Roles.
Report Overviews
Learner Status by Course
The Learner Status by Course allows for viewing learner enrollment and completion dates for a course. The report can filter learners by:
- Administered By, Course Title, Section, Section Status
- Collegiate or administrative unit, ZDeptID, DeptID, Department
- Learner Type (Employee, Student, Guest, Other)
- Guest learner type is an account that does not have an EmplID (Guest, Friend, Sponsored, Department, etc.)
- Other learner type is an account that does have an EmplID (former students, former employees, etc.)
- Learner Status (Actively Enrolled, Complete, Incomplete, Withdrawn)
The report also has date range filters for Enrolled Date, Completed Date, and Due Date.
The filters can be saved as a custom view to quickly facilitate viewing the data in the future. Jump to Saving report filters lower down in this article.
The report data is updated hourly.

Course/Section Enrollment
View total numbers of enrolled, in progress, and complete learners for course sections by who administers the course. The report has filters for:
- Administered By
- Course Title
- Section
The report also has date range filters for Enrolled Date, Completed Date, and Due Date.
The filters can be saved as a custom view to quickly facilitate viewing the data in the future. Jump to Saving report filters lower down in this article.
The report data is updated hourly.

Student Learner Status by Course
The Student Learner Status by Course allows for viewing learner enrollment and completion dates for a course. The report can filter learners by their academic status:
- Course Title, Learner Status, Year of Completed
- Institution, Academic Plan, Academic Career, Academic Program
The filters can be saved as a custom view to quickly facilitate viewing the data in the future. Jump to Saving report filters lower down in this article.
The report data is updated hourly.

Multiple Learners and Courses
The Multiple Learners and Courses allows for viewing the status of multiple learners in multiple courses. There are two versions of the report: search for learners using the EmplID or by the Internet ID. Select the toggle button in the upper right to switch between the two versions.
The filters can be saved as a custom view to quickly facilitate viewing the data in the future. Jump to Saving report filters lower down in this article.
The report data is updated hourly

Instructors
The instructors report displays a table of all instructors assigned to a course section in Training Hub. There are columns for:
- Course
- Section Name
- Section Status
- Section Info (start date for ILT, Canvas, or Other Online)
- Instructor Name
- Total Learners (enrolled, completed, in progress)
- Canvas Course Site URL
- This column is not displayed in the report, but will be included in the download.
And there are filters for:
- Administered By
- Course
- Section Status
- Instructor
The filters can be saved as a custom view to quickly facilitate viewing the data in the future. Jump to Saving report filters lower down in this article.
Proxy Enrollers
This report is a list of people with proxy enroller access to Training Hub by administrative group, course, and name. There are columns for:
- Course Name
- Course Status
- Administered By
- Full Name
- Email Address
- Proxy Enroller's Department
And there are filters for:
- Administered By
- Full Name
- Course Name
- Course Status
- Proxy Enroller's Department
The filters can be saved as a custom view to quickly facilitate viewing the data in the future. Jump to Saving report filters lower down in this article.
Training Administrators
The Training Administrators report is a table of people with training administrator access to Training Hub by administrative group, and name. There are columns for:
- Administered By
- Training Admin Name
- Email Address
There are filters for:
- Administered By
- Training Admin Name
The filters can be saved as a custom view to quickly facilitate viewing the data in the future. Jump to Saving report filters lower down in this article.
Supervisor
The Supervisor report displays a table of training records for all of the direct reports for a supervisor. There are columns for:
- Employee
- Course Name
- Section Name
- Enrolled Data
- Due Date
- Completed Date
There are filters for:
- Employee
- Employee Status
- Course Name
- Completed Date
- Completed in Fiscal Year
The report is updated hourly.

Accessing reports
- Log into Training Hub
- Select the Admin Console.
- Scroll down to Training Hub Reports.
- Select the report to view.
- If prompted, select the blue Sign in to Tableau Server button
- Use other filters as desired
Using filters to view a subset of data
To view a subset of the data:
- Select a filter
- Uncheck All
- It will take a few seconds to reload the report
- Select the checkbox for the item(s)
- Multiple items can be checked
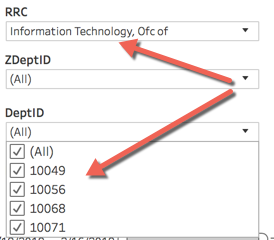
- For the DeptID and Department filters in the Learner Status by Course, it's best to first filter on either the RRC or the ZDeptID first to limit the number of departments listed.
Date Range filters
The Learner Status by Course and Course/Section Enrollment reports have filters that will limit the data displayed based on certain date based events.

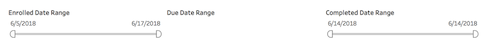
If the report is filtered in a way such that no event occurred, the filter will not be displayed. In the following image, no learner has a due date assigned for any of the courses selected, so the middle filter (Due Date Range) is not displayed:
There are two buttons on the right side of the date filter: a clear filter button, and a data action list. The data action list controls what data is included in the table.
- Values in Range
- In the example below, only learners that have a due date between 6/7/2018 and 11/2/2021 will be displayed
- Values in Range and Null Values
- In the example below, only learners that have a due date between 6/7 and 11/2/2021 AND any learner with no due date will be displayed
- Null Values Only
- In the example below, all learners without a due date will be displayed
- Non-Null Values Only
- In the example below, all learners that have a due date between 6/7/2018 and 11/2/2021 will be displayed.

- In the example below, all learners that have a due date between 6/7/2018 and 11/2/2021 will be displayed.
Saving report filters
After setting the filters on a report, you can save the custom view so it can easily be accessed in the future. The buttons to save/open/manage custom views are on the toolbar below the data table.
Save a Custom View
- Scroll down to the toolbar below the data table.
- Select Save Custom View. A modal window is displayed.
- Enter a name for the custom view.
- Optional: select Make it my default.
- Select Save.
Open a Custom View
- Scroll down to the toolbar below the data table.
- Select Switch to or Manage a Custom View. A modal window is displayed with a list of saved views.
- Select a view from the list to display. The data is refreshed in the report to reflect the saved filters.
Downloading Data
Both of the reports are made up of three items: the filters in the top left, the pie chart in the top right, and the data table in the bottom half.
Each report has two buttons in the upper right corner:
- Download PDF
- This will download the report as a PDF
- The Include option will default to the whole report, select the dropdown to change what is included in the download. For example, on the Learner Status report, you could include only the Learner Data table
- Download Data
- This will download the data for the report
- There is an option for either Excel format or CSV (comma separated values) format